US September payrolls rose 29,000: revisions reveal the weaker picture
US September payrolls rose 29,000 and unemployment was 4.2%. Downward revisions to the previous two months make the slower hiring picture more apparent.
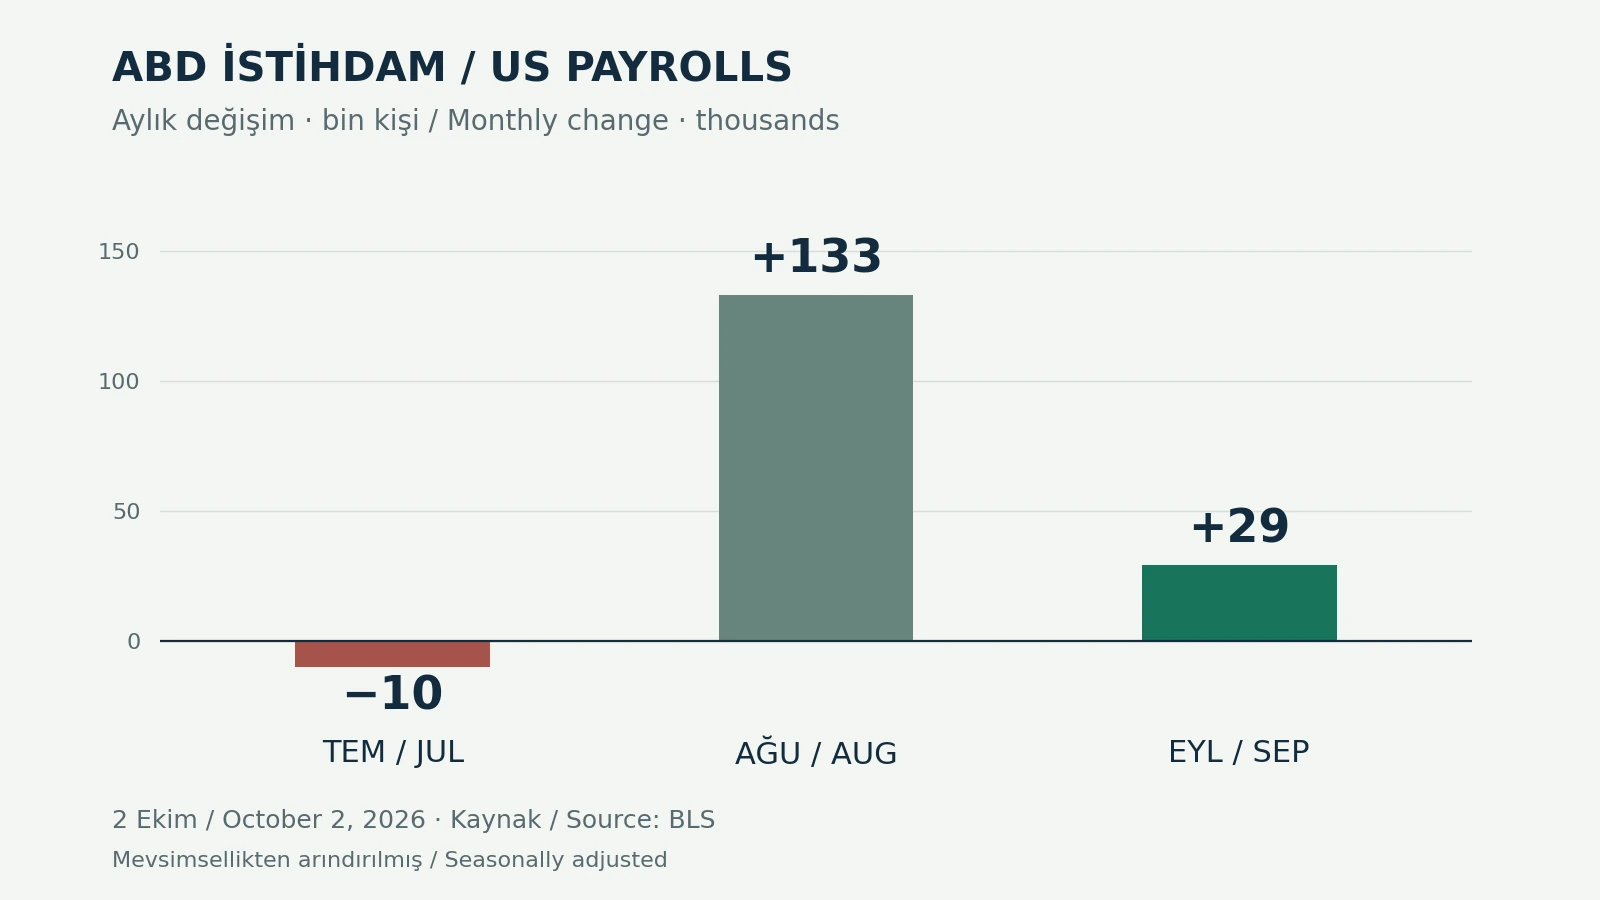
Read all three months in the same data vintage
Monthly change, thousands. August and September figures are preliminary.
| Month | Previous release | October 2 series | Revision |
|---|---|---|---|
| July | +21 | −10 | −31 |
| August | +162 | +133 | −29 |
| September | — | +29 | First release |
Slower hiring sits behind the headline
Friday’s release does not point to a strong acceleration in hiring. One soft month can be a temporary pause; the assessment changes when earlier months are also marked down. Comparing September with the revised series is therefore more useful than reading its headline in isolation. Employment is still expanding, but there are more reasons to be cautious about the pace of new job creation.
Why the 60,000 revision matters
July and August were revised down by a combined 60,000. The hiring picture available a month ago now looks weaker. Subtracting that revision from September’s gain would be a mistake: the changes belong to different months. The table shows how earlier estimates were corrected; it does not say the economy lost jobs in September. Older stories describe the initial releases, while a current assessment should use the latest series.
Wages and hours provide a second check
Table B shows average hourly earnings at $37.76 in August and $37.81 in September, with the workweek at 34.4 hours. Payrolls measure the number of jobs; earnings and hours help describe employees’ capacity to generate income. Slower hiring and shorter hours are different developments. Assessing how much demand has cooled also requires asking whether businesses are cutting the hours of staff they already employ.
The Fed still faces a difficult trade-off
Slower hiring can make the employment cost of tight monetary policy more visible. Inflation sits on the other side of that discussion. If labor indicators weaken while price pressures persist, a central bank may have less room to act than an employment-only reading suggests. This report cannot establish a certain interest-rate decision. The inflation path matters alongside whether the hiring slowdown continues.
Gold, the dollar and bonds have two channels to consider
The first channel is interest-rate expectations: stronger expectations of lower rates could weigh on the dollar and yields, potentially helping non-yielding gold. The second is growth risk: if weakness becomes deep enough to affect corporate revenue, demand for risk assets could suffer. The two channels need not be equally strong. One employment number cannot determine the direction of gold, currencies or shares; expectations already reflected in prices also matter.
A lira portfolio needs a separate currency calculation
For an investor holding a dollar-denominated asset, its dollar price and USD/TRY are separate inputs. A hypothetical 2% asset-price gain combined with a 1% fall in USD/TRY produces roughly a 0.98% lira gain: 1.02 × 0.99 − 1. This is not a forecast. It shows why both prices must be combined when reading the lira performance of foreign shares or a dollar-based fund. Commissions, taxes and bid-ask spreads are additional costs.
What matters for a business selling into the US?
After the headline unemployment rate, the more useful question is whether a company’s own customers are changing orders or payment behavior. Softer hiring need not affect a consumer-facing business and a manufacturer working under long-term contracts equally. Revenue volume, pricing, order backlogs and collection times should be read together in company results. Translating an economy-wide release directly into one company’s revenue forecast can be misleading.
Calculation notes
The chart and table use seasonally adjusted monthly changes. The three-month average is (−10 + 133 + 29) / 3 = 50.67 thousand. The portfolio illustration multiplies hypothetical price and currency changes. No market quote, survey forecast or Fed probability has been added.
More from the FinRateX desk
All news → GOLD · CURRENT PRICE GUIDE
How is Türkiye's Republic gold coin priced? The four-layer answer
 TÜRKİYE ECONOMY · INFLATION
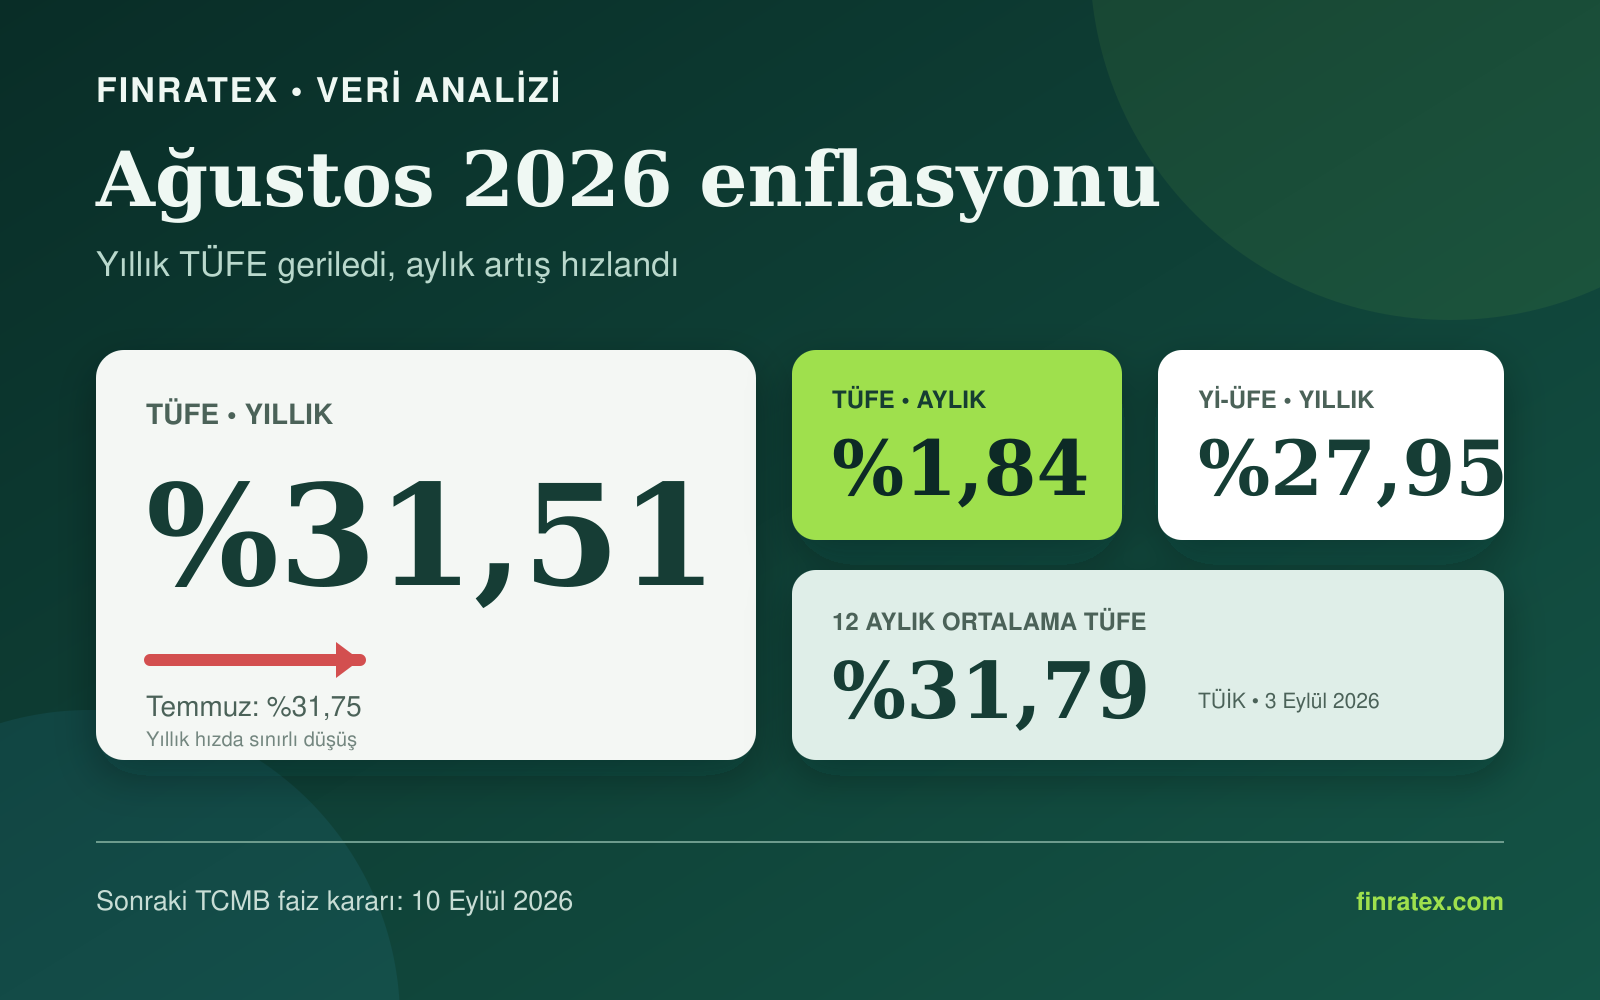
Türkiye's August 2026 inflation was 31.51%: what it means for rates and markets
 FOREIGN EXCHANGE · GLOBAL ANALYSIS