What happened at Niger’s Goumeri W-8 oil well—and what can it tell us about prices?
Niger’s Goumeri W-8 incident began September 25. We separate the October 12 status, unknown production losses and the limits of drawing oil-price conclusions.
In this article

An oil and gas release began at Niger’s Goumeri W-8 well on September 25, 2026, in the Agadem block operated by CNPC Niger Petroleum S.A. The Petroleum Ministry’s October 12 statement describes the situation as partially contained but not fully controlled. That dated status does not establish conditions at the site on October 15.
Three distinctions that matter
- The incident began September 25; the official status is dated October 12, 2026.
- Environmental and operational danger is not a measure of lost production.
- The disclosed information alone does not produce a Brent or Turkish pump-price forecast.
What each piece of information tells us
An incident and the volume of oil unavailable to global markets are different things.
| Item | Known or missing information | Market relevance |
|---|---|---|
| Location | Goumeri W-8, Agadem, Niger | Niger should not be confused with Nigeria. |
| Status date | October 12, 2026 | Cannot automatically be extended to later days. |
| Lost production | No barrels-per-day figure in the reviewed statement | Global supply impact cannot be quantified. |
| Duration and exports | No firm recovery date or export-loss figure | Cumulative volume and shipment impact remain uncertain. |
Why the site risk matters
ANP’s October 13 account of the ministry statement says the integrity of nearby W-3 and W-4 wells sharing the platform was also compromised. It reports an independent investigation with Algerian expertise and priorities including protecting people, preventing fire, limiting environmental damage and stopping the release. The causes had not been fully established. These details describe a serious operational event; they do not measure how many barrels have been removed from global supply.
Which links to oil prices are still missing?
EIA explains that production disruptions can reduce supply and uncertainty about their duration can increase volatility. This does not imply that every incident raises prices by the same amount. For Goumeri, the starting points would be pre-incident production, capacity actually taken offline, disruption duration and delivery effects. Other producers’ responses, inventories and demand would then need consideration. A price move occurring on the same day as a news story does not establish that story as its sole cause.
Why seven days and 30 days give different answers
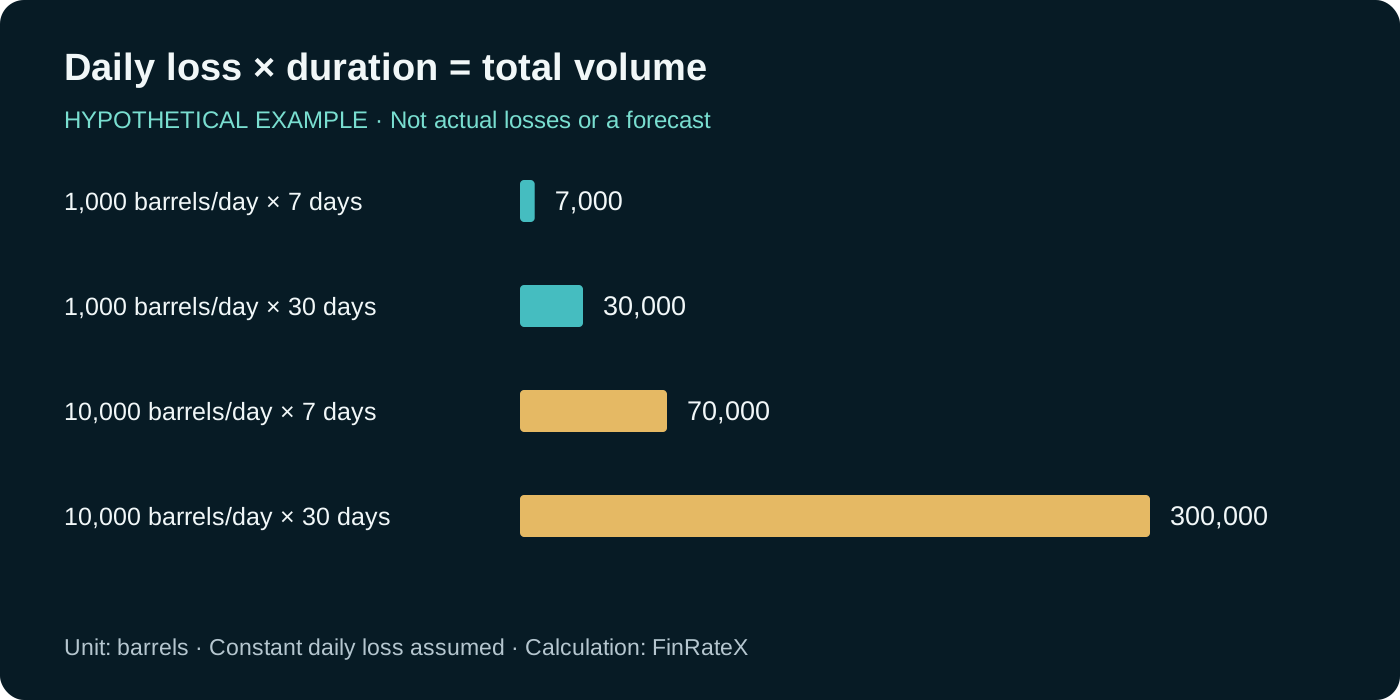
To illustrate the arithmetic only, assume a loss of 1,000 barrels a day: seven days gives 7,000 barrels and 30 days gives 30,000. At an assumed 10,000 barrels a day, the totals become 70,000 and 300,000 barrels. None of these four figures is Goumeri data, a spill estimate or a pricing model. The example shows why a daily flow must not be confused with a period total. Lost production, oil spilled into the environment and undelivered market supply are also distinct measures.
What it means for my money or business
For a fuel-consuming business, this report does not automatically change the price in an existing supply contract. Assessing the invoice effect requires the product specification, pricing period, exchange rate and delivery terms in that contract. For a driver in Türkiye, an individual crude-field incident is not a pump-price announcement. Someone following oil-related assets should ask which company is exposed to which field and contract; assuming all assets associated with the word ‘oil’ move in the same direction is not enough.
Calculation notes
Incident and status dates are kept separate. No undisclosed barrels-per-day loss, damage cost, recovery date or Brent target is estimated. Chart values use assumed constant daily losses multiplied by days; they exclude gradual recovery, inventory deliveries and replacement production. This analysis is not investment advice.
Related analysis
All news → Gold, energy and commodities
Türkiye's October 1 gasoline change: Is the TRY 12.48 hike official?
 Gold, energy and commodities
Türkiye fuel prices on September 7, 2026: why diesel is moving differently
 Gold, energy and commodities